Resource Usage
Online Help > Resource Usage
What does “Resource Usage” functionality do?
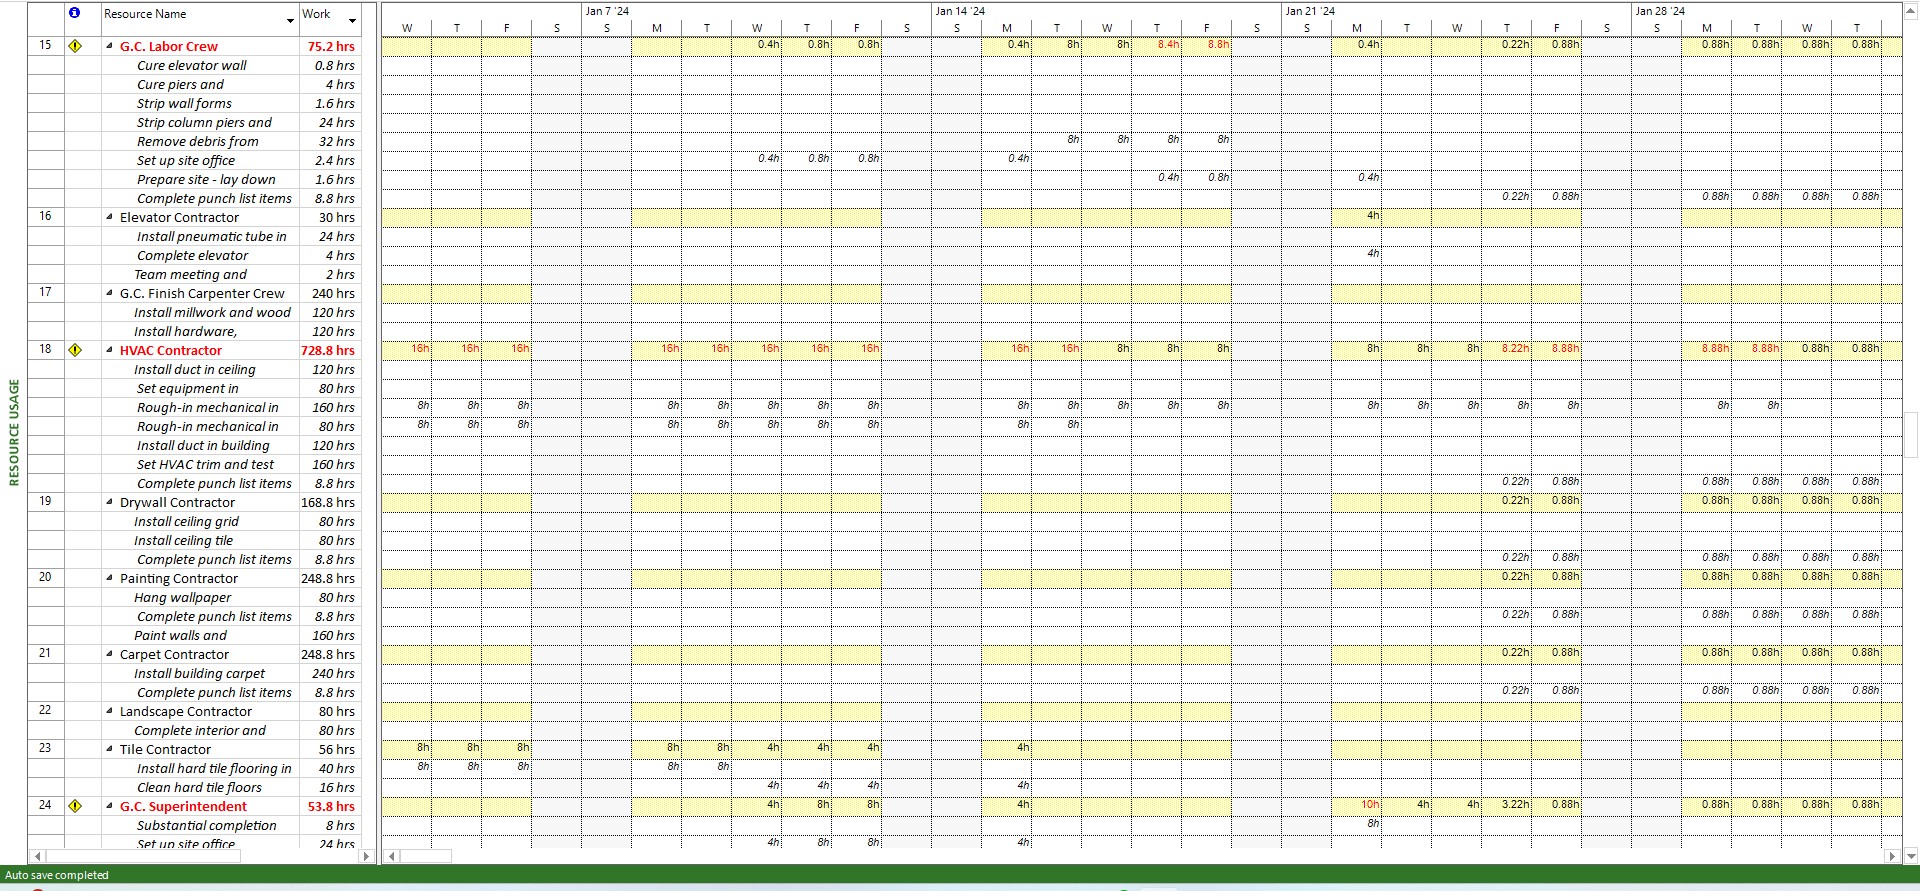
The Resource Usage view lists for each resource the assigned tasks and the total amount of work that the resource is scheduled to perform on each task, whether per day, week, month, or other time increment.
What is Resource Usage view?
Resource Usage view is a functionality that lists for each resource the assigned tasks and the total amount of work that the resource is scheduled to perform on each task.
I want to export the Resource Usage data into Excel (CSV). However, I can only export the total usage in hours. How can I export the breakdown of month?
Exporting the Resource Usage data into Excel will not include a monthly breakdown. For a better Resource Usage visualization, we suggest exporting Resource Usage as PDF. This will result into a table view of the monthly breakdown. You can use in your presentations and reports.
Why can I not edit the actual work in Resource Usage view?
We are sorry but we don’t support edits in Resource Usage view or on Actual Work field.
I have an issue with Resource Usage view.
Please download and install the latest app from this link: Download Project Plan 365.
How to use the Resource Usage view?
In order to use the Resource Usage view, please go to menu View-Resource Usage or in View Bar click on Resource Usage button.
When should I use the Resource Usage view?
Use the Resource Usage view when you want to:
- View information on a resource's task assignment, such as cost, work allocation, and work availability.
- See which resources are overallocated and by how much.
- View assignments more evenly among resources.
- Find out how many hours each resource is scheduled to work.
- See the work capacity (in terms of a percentage) for each resource.
- View how much time each resource has available for additional work assignments.
- View each resource's work progress in days, weeks, months, or other time increments.
- View resource costs.
- View the amount of work a person spends on a task.
Can I customize the Resource Usage view?
To make the Resource Usage view fit your needs exactly, you can customize it or create a new version. When you close your project, the customized view will be lost. To customize the Resource Usage view, you can:
- Display different resource information.
- Display information in different timescales.
- Change the units of time that are displayed to view your project at the level of detail you need.
- View usage information for a specific time period.
Can I change the table for Resource Usage view?
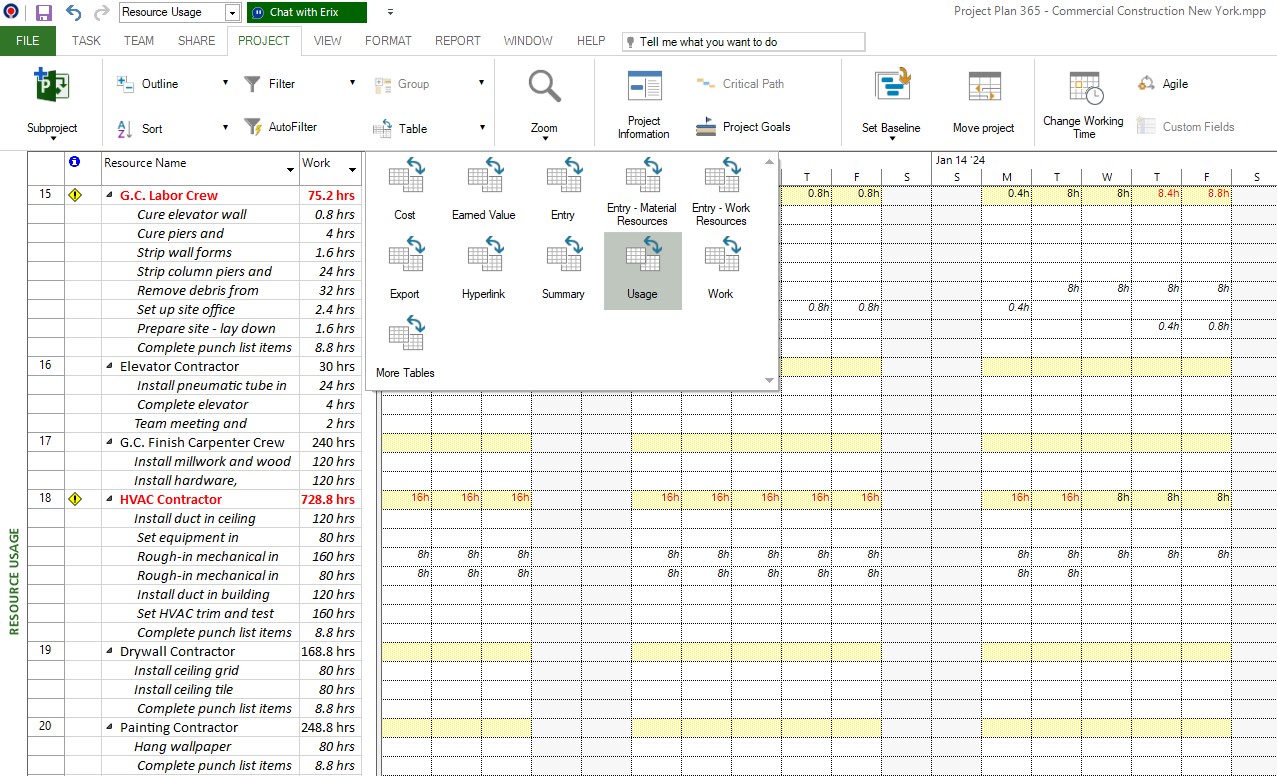
The Resource Usage view displays categories of information about the resources, arranged in tables. The default table for the Resource Usage view is the Usage table, but you can select any of the resource tables to display information about the project's resources. To do this, go to Project-Table and select the table you want to view.
Can I apply a filter in Resource Usage view?
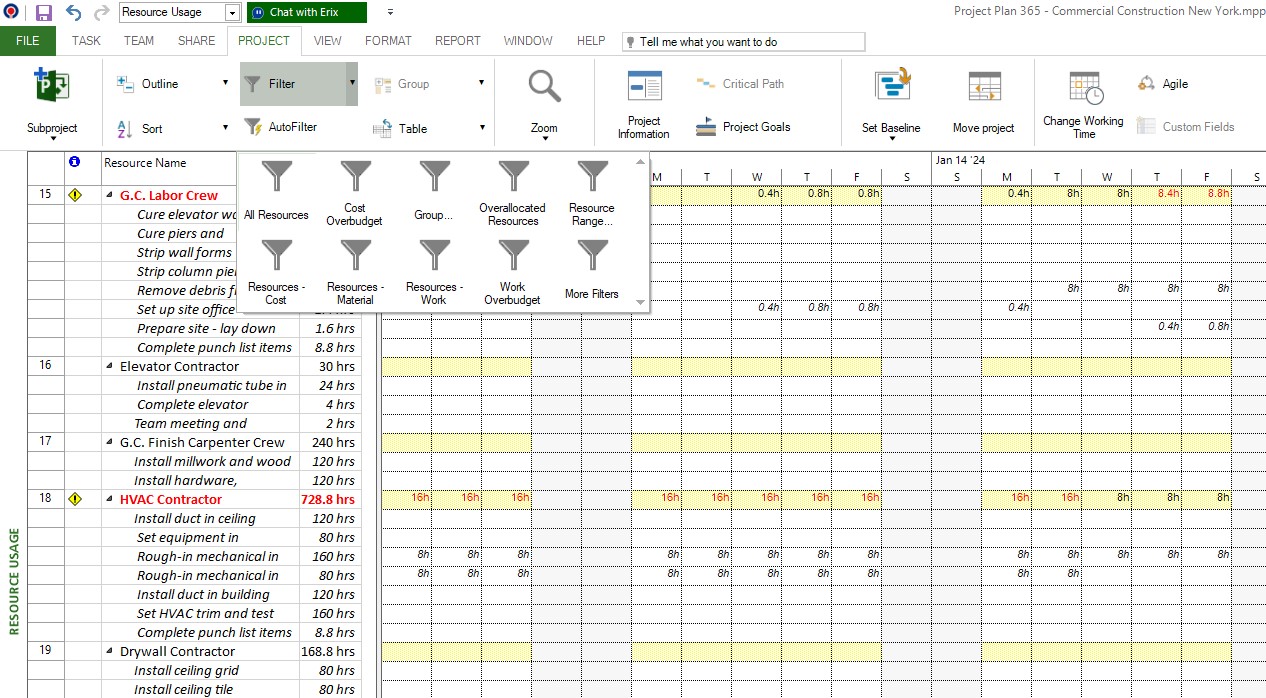
The Resource Usage view can use any of the resource filters to display only the information you want to see. When you select a filter, the Resource Usage view displays the information as defined by that filter's criteria. The default filter is the All Resources filter. To apply a filter, please go to Project – Filter.
Can I sort the data in Resource Usage view?
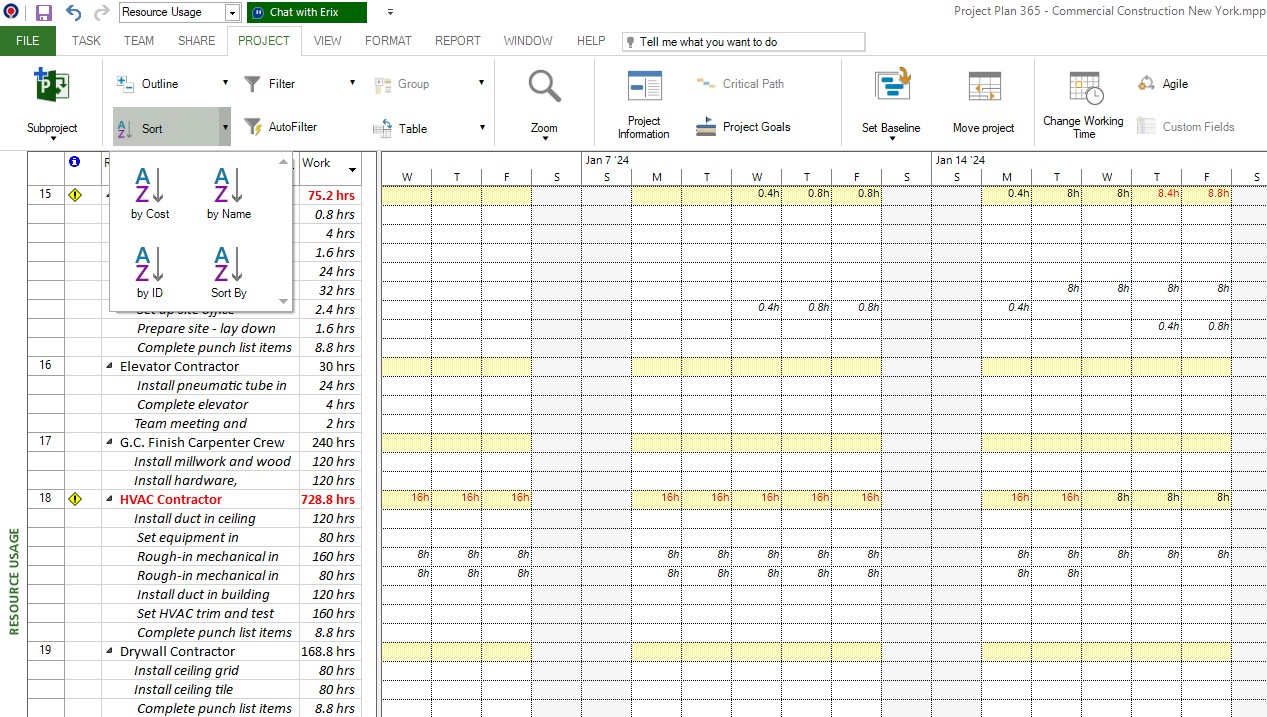
You can apply different sort criteria to the resources and assignments from the Resource Usage view. To do this go to Project-Sort.
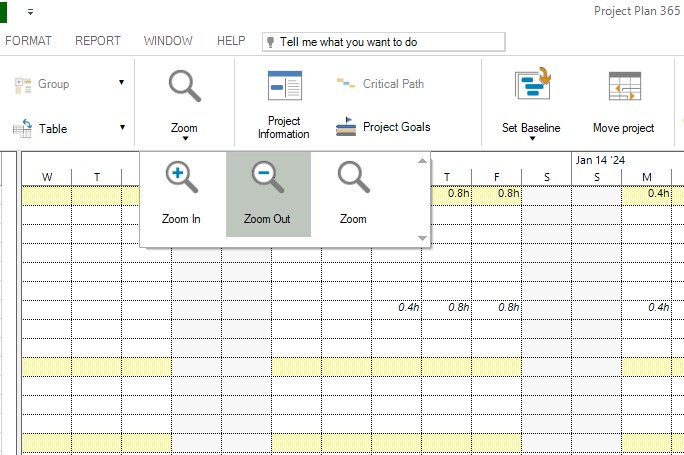
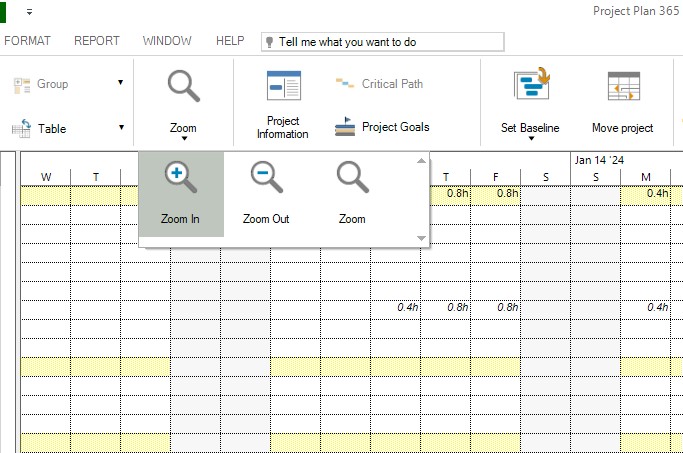
Can I apply a zoom in/zoom out in Resource Usage view?
You can apply a zoom in/zoom out in Resource Usage view by going to the Project menu - Zoom. In this way, you can zoom out to get a bigger picture of your project’s tasks by displaying Years and Months and you can zoom in to see the exact start and finish dates for your project’s tasks by changing the timescale to Weeks and Days.
Is there any way to set a default view?
To set a view by default, the Editor needs to save the file with that specific view being opened.
How can I set for each day the real time allocated by a resource on a task?
We are sorry, but this cannot be achieved easily in our app.
Our application automatically calculates the working hours for a task based on duration and resource units.
Why I can’t see the “Resource Usage view” button in ribbon on the Mac platform?
If the “Resource Usage View” button is not visible in ribbon, please press "More" button. You should be able to find in the dropdown the button that doesn't fit inside the ribbon because of the small window size.
How do I see the capacity of the resources?
To view information on a resource’s task assignment, such as cost, work allocation, and work availability you can use the Resource Usage view. In order to use the Resource Usage view, please go to menu View-Resource Usage or in View Bar click on Resource Usage button.
Is there a way to add ‘Cost’ in the right side of the Resource Usage view?
We are sorry but it isn’t possible to add the cost in the right side of the Resource Usage view at the moment.
How can I navigate back to a specific task in the Gantt Chart view after selecting it in the Resource Usage view?
Please know that it is not possible to navigate back to a specific Task in the Gantt Chart view after selecting it in Resource Usage view in our application, at this point.
How can I always display by default the current date in the Resource Usage view?
We are sorry but displaying by default the current date in the Resource Usage view is not possible in our application at this point.
If you want to display the current date in the Resource Usage view, without scrolling in the view, you can go to the Project menu – Go to option, select the current date from the “Date” field and press “OK”.
Step by step on how to use the Resource Usage view:
1. In the View Bar, select Resource Usage.
2. You will notice that the view changes.
Note: The Resource Usage view displays categories of information about the resources, arranged in tables. The default table for the Resource Usage view is the Usage table, but you can select any of the resource tables to display information about the project's resources.
3. Use any of the resource filters to display only the information you want to see. When you select a filter, the Resource Usage view displays the information as defined by that filter's criteria. The default filter is the All Resources filter.
4. Apply different sort criteria to the resources and assignments from the Resource Usage view.
5. The timeline units for the right portion of the Resource Usage view are displayed at the top of the chart. By default, displays two units of time. You can adjust these time units to display up to three units of time, and you can change it so that different time units are displayed.
For example, you can zoom out to get a bigger picture of your project's tasks by displaying Years and Months.
Or you can zoom in to see the exact start and finish dates for your project's tasks by changing the timescale to Weeks and Days.
Best uses
Use the Resource Usage view to:
- View information on a resource's task assignment, such as cost, work allocation, and work availability.
- See which resources are overallocated and by how much.
- View assignments more evenly among resources.
- Find out how many hours each resource is scheduled to work.
- See the work capacity (in terms of a percentage) for each resource.
- View how much time each resource has available for additional work assignments.
- View each resource's work progress in days, weeks, months, or other time increments.
- View resource costs.
- View the amount of work a person spends on a task.
Customization
To make the Resource Usage view fit your needs exactly, you can customize it or create a new version. When you close your project, the customized view is lost. To customize the Resource Usage view, you can:
- Display different resource information.
- Display information in different timescales.
- Change the units of time that are displayed to view your project at the level of detail you need.
- View usage information for a specific time period.
| Related | Resource Sheet | Task Usage | Resource Graph | Gantt Chart | Tracking Gantt |
| Platform | Windows | Mac | iOS | Web | Android |
| ✔ | ✔ | ✔ | ✔ | ✔ | |
| Product | Project Plan 365 | ||||
| Article ID | 124 | ||||
| Date | 9/18/2024 |


