Task Usage
Online Help > Task Usage
What does “Task Usage” functionality do?
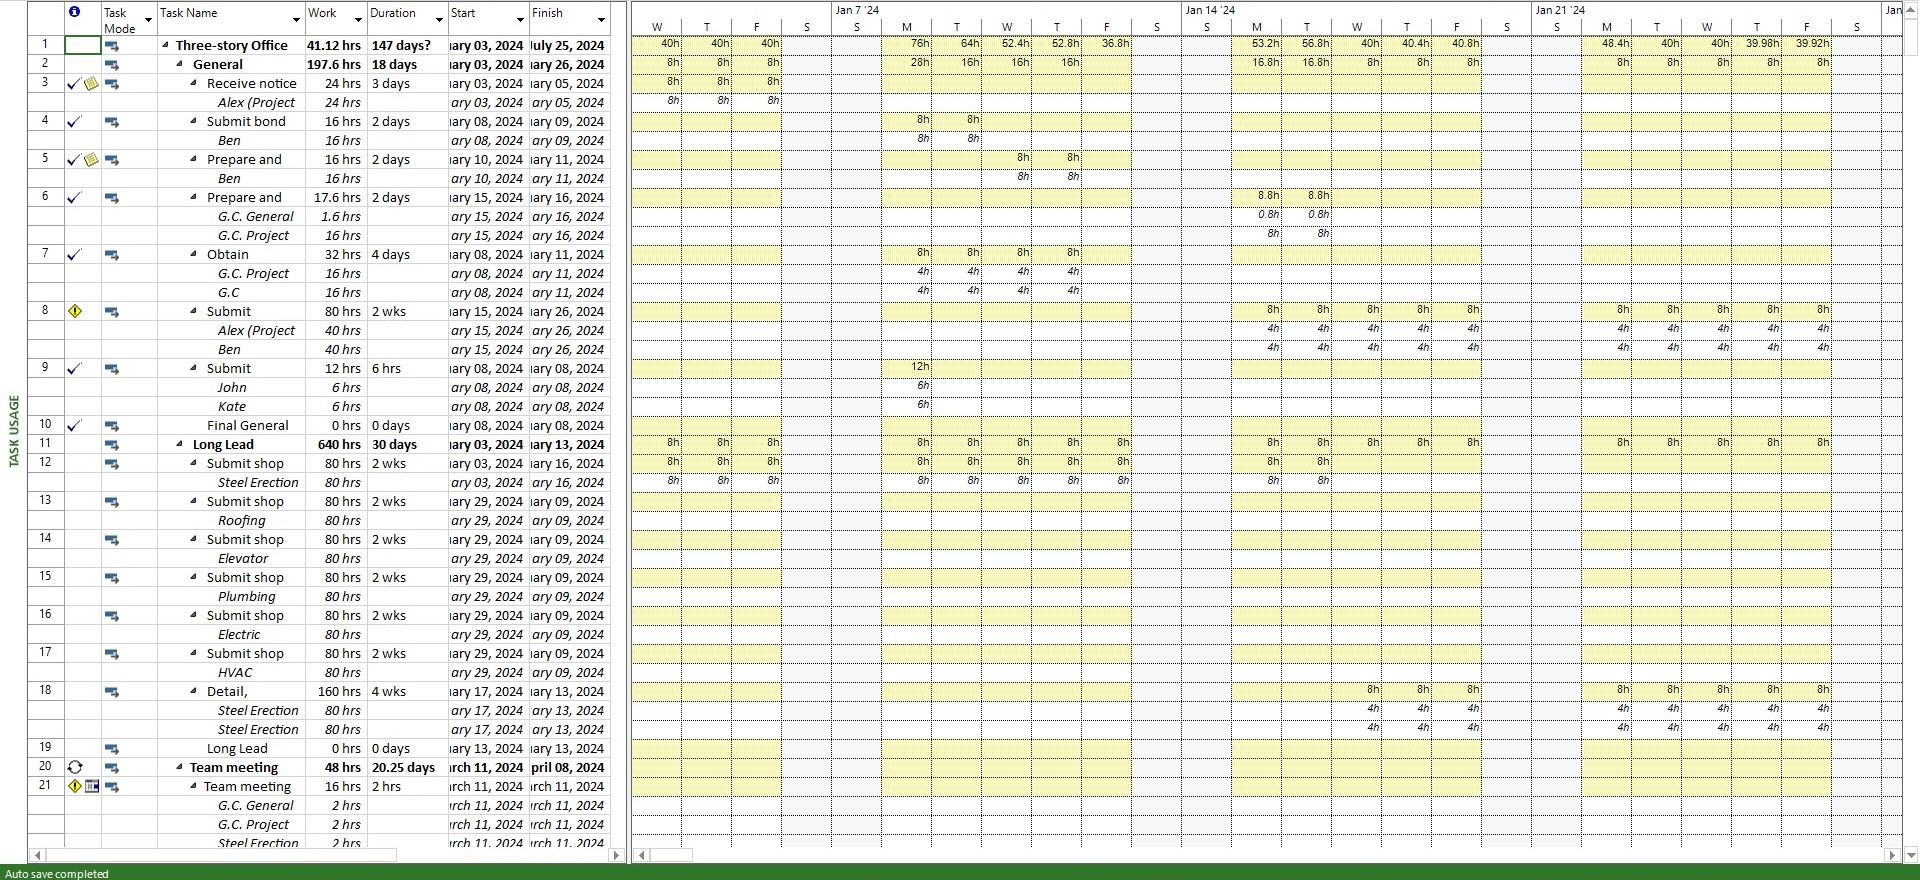
The Task Usage view lists for each task the resources assigned to it and the amount of work that each resource has performed over time, whether per day, week, month, or other time increment.
How to use the Task Usage view?
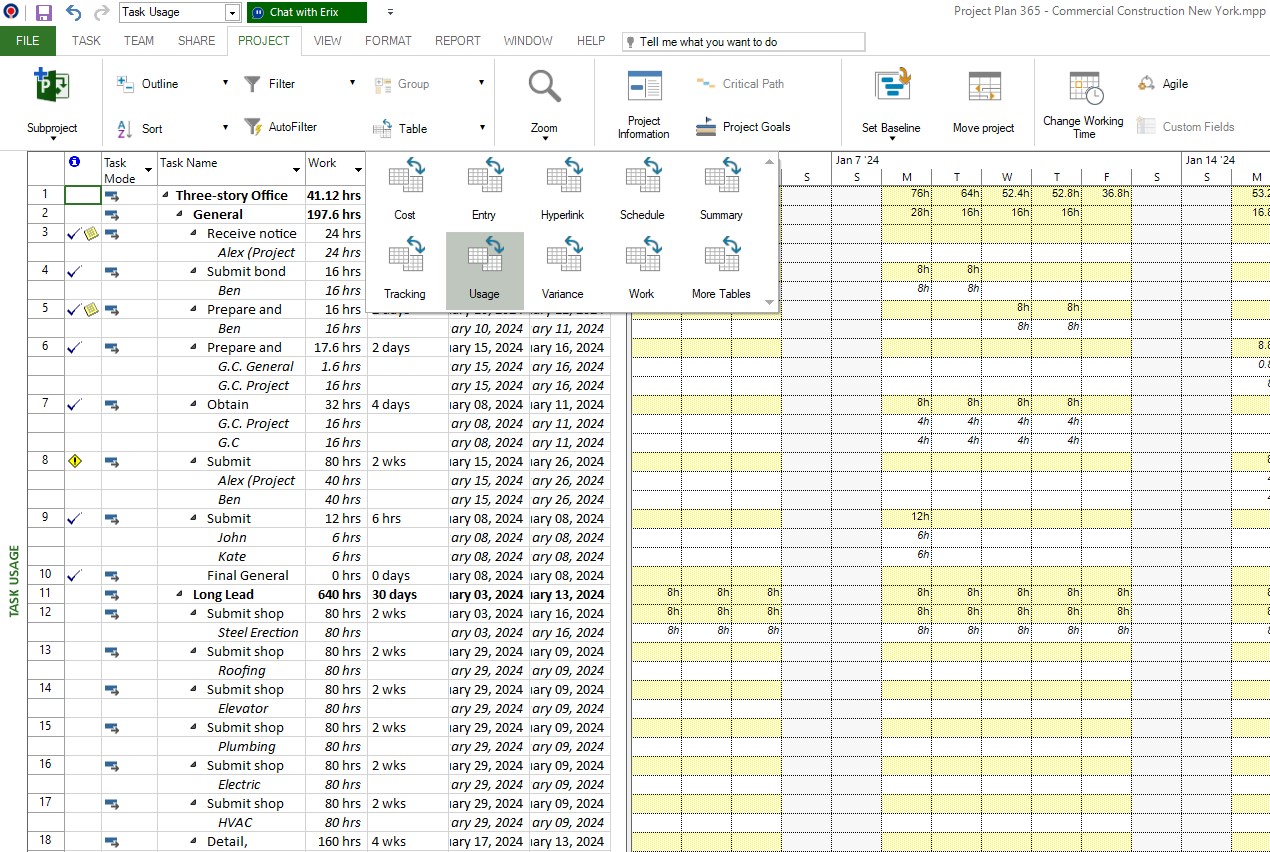
In order to use the Task Usage view, please go to menu View-Task Usage or in View Bar click on Task Usage button.
When should I use the Task Usage view?
Use the Task Usage view to:
- View task and resource information together, such as work, start and finish dates, cost, work allocation, and work availability.
- View task assignments more evenly across resources.
- Find out how many hours each resource is scheduled to work on particular tasks.
- View the amount of work a person spends on a task by setting work contours.
Can I customize the Task Usage view?
To make the Task Usage view fit your needs exactly, you can customize it or create a new version. When you close your project, the customized view is lost. To customize the Task Usage view, you can:
- Display different task information.
- Change the units of time that are displayed to view your project at the level of detail you need.
- View usage information for a specific time period.
Can I change the table for Task Usage view?
The Task Usage view displays categories of information about the tasks, arranged in tables. The default table for the Task Usage view is Usage, but you can select any of the task tables to display information about the project's tasks and associated resources. To do this, go to Project - Table and select the table you want to view.
Can I apply a filter in Task Usage view?
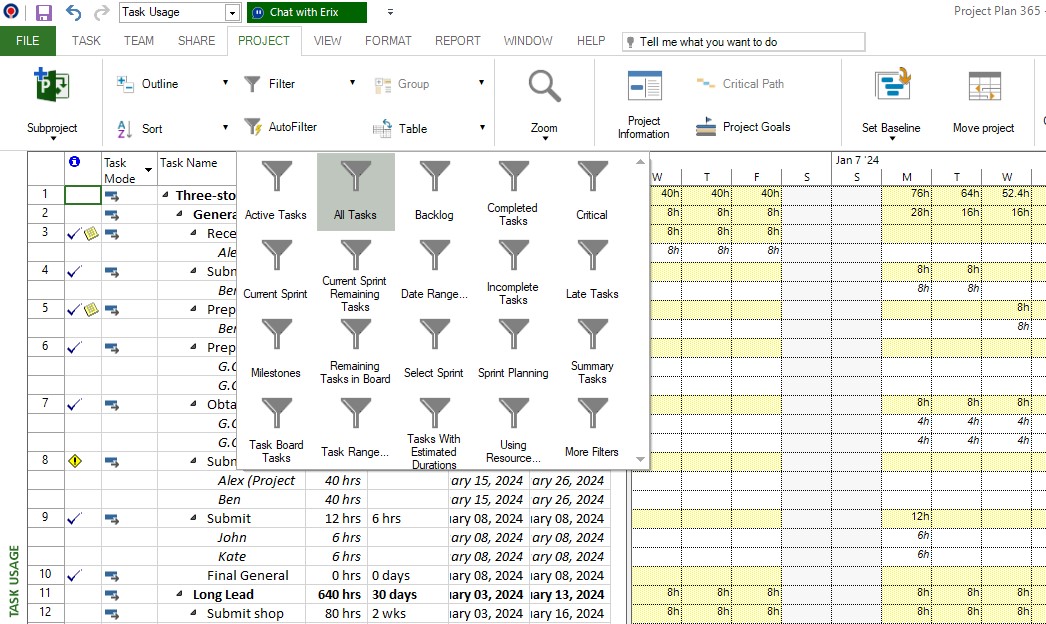
The Task Usage view can use any of the task filters to display only the tasks you want to see. When you select a filter, both the sheet and timescale portions of the Task Usage view display the information as defined by that filter's criteria. The default filter is the All Tasks filter. To apply a filter, please go to Project – Filter.
Can I sort the data in Task Usage view?
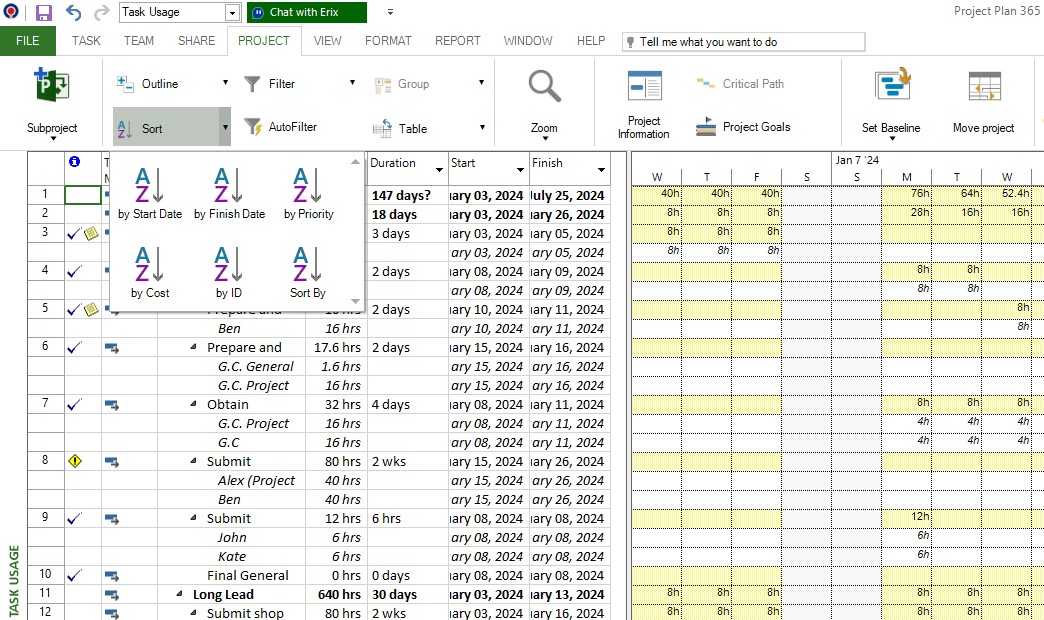
You can apply different sort criteria to the resources and assignments from the Task Usage view. To do this go to Project - Sort.
Can I apply a zoom in/zoom out in Task Usage view?
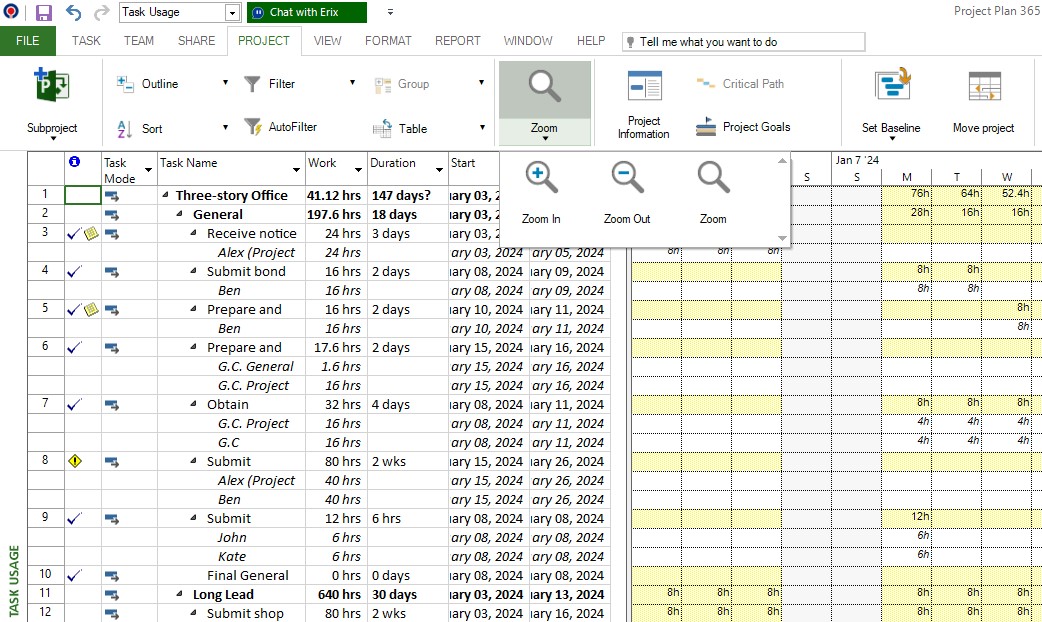
You can apply a zoom in/zoom out in Task Usage view by going to the Project menu - Zoom. In this way, you can zoom out to get a bigger picture of your project’s tasks by displaying Years and Months and you can zoom in to see the exact start and finish dates for your project’s tasks by changing the timescale to Weeks and Days.
Is there any way to set a default view?
To set a view by default, the Editor needs to save the file with that specific view being opened.
What is a Task Usage View?
It is a view that lists for each task the resources assigned to it and the amount of work that each resource has performed over time. It is a matrix of work assignments. In a table spanned over the project's period, workloads are presented for each task, and within it, each resource, if any is available.
How can I edit working time in Task Usage view?
We are sorry but we don’t support editing Task Usage view.
I need to see the cost instead of hours in the Task Usage view.
We are sorry but it isn’t possible to add the cost in the right side of the Task Usage view at the moment.
How can I view how many work hours are assigned to all my subprojects until a certain date?
If you want to see the work hours for all of your subprojects, you can use the Task Usage View. Go to the Task Usage view, collapse all of your subprojects, go to the Format menu – Timescale and from Middle Tier and Bottom Tier tabs, change the units as desired and click OK.
Step by step on how to use the Resource Usage view:
1. Go to menu View-Task Usage or in View Bar click on Task Usage button.
2. You will notice that the view changes.
Note: The Task Usage view displays categories of information about the tasks, arranged in tables. The default table for the Task Usage view is Usage, but you can select any of the task tables to display information about the project's tasks and associated resources.
3. Use any of the resource filters to display only the information you want to see. When you select a filter, the Task Usage view displays the information as defined by that filter's criteria. The default filter is the All Tasks filter.
4. Apply different sort criteria to the resources and assignments from the Task Usage view.
5. The timeline units for the right portion of the Task Usage view are displayed at the top of the chart. By default, displays two units of time. You can adjust these time units to display up to three units of time, and you can change it so that different time units are displayed.
For example, you can zoom out to get a bigger picture of your project's tasks by displaying Years and Months.
Or you can zoom in to see the exact start and finish dates for your project's tasks by changing the timescale to Weeks and Days.
Best uses
Use the Task Usage view to:
- View task and resource information together, such as work, start and finish dates, cost, work allocation, and work availability.
- View task assignments more evenly across resources.
- Find out how many hours each resource is scheduled to work on particular tasks.
- View the amount of work a person spends on a task by setting work contours.
Customization
To make the Task Usage view fit your needs exactly, you can customize it or create a new version. When you close your project, the customized view is lost. To customize the Task Usage view, you can:
- Display different task information.
- Change the units of time that are displayed to view your project at the level of detail you need.
- View usage information for a specific time period.
| Related | Resource Sheet | Task Usage | Resource Graph | Gantt Chart | Tracking Gantt |
| Platform | Windows | Mac | iOS | Web | Android |
| ✔ | ✔ | ✔ | ✔ | ✔ | |
| Product | Project Plan 365 | ||||
| Article ID | 144 | ||||
| Date | 9/18/2024 |
